Map View
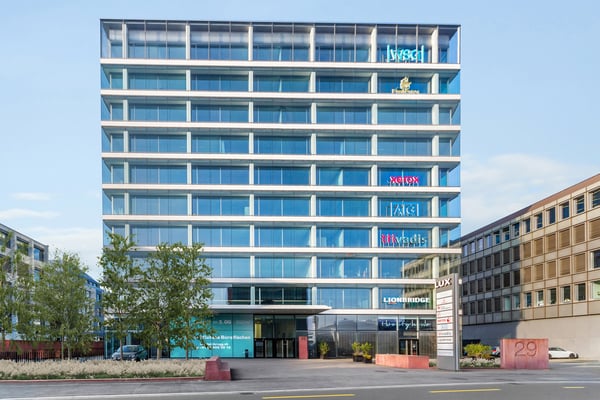
Repräsentative Bürofläche mit Charakter
Sägereistrasse 29
An attraktiver Geschäftslage erwartet Sie eine vielseitig nutzbare Bürofläche mit rund 802 m² im 1....

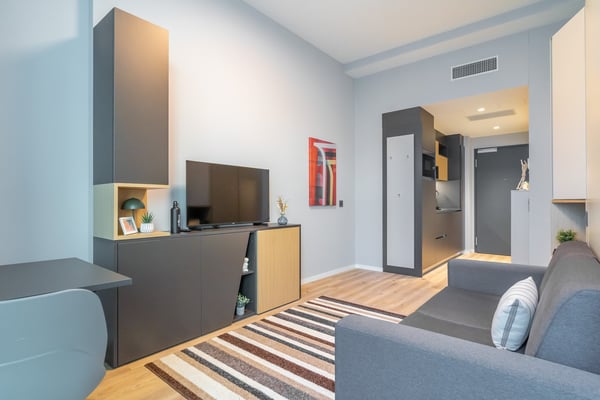
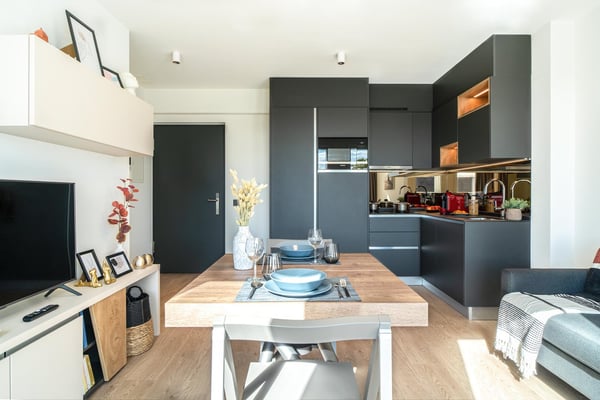
City Pop Geneva – Surville: Modern Living with Flexibility and Comfort
Chemin de Surville 1
Opening May 22, 2025 – Discover fully furnished, design-forward apartments in the brand-new City Pop...

City Pop - Cosy Studio Apartments in San Gallen
Merkurstrasse 1
City Pop - Die flexible Lösung für kurze und lange Aufenthalte, die Ihnen ein Gefühl von Zuhause vermittelt.Neu

City Pop - Cosy Studio Apartments in Basel
Hochstrasse 16
City Pop - Die flexible Lösung für kurze und lange Aufenthalte, die Ihnen ein Gefühl von Zuhause vermittelt.Seit
City Pop - Cosy Studio Apartments Baden, AG
Brown Boveri Strasse 7
City Pop - Die flexible Lösung für kurze und lange Aufenthalte, die Ihnen ein Gefühl von Zuhause vermittelt.Neu

City Pop - Cosy Studio Apartments close to Zürich centre
Rotbuchstrasse 9
Neu eröffnet! Ab dem 10.04.2025 bieten wir zentral gelegene Apartments im Gebäude City Pop Zurich...

Last available Apartments at City Pop Zürich Oerlikon Central
Siewerdtstrasse 75
Neu eröffnung! Ab dem 13.03. bieten wir zentral gelegene Apartments im City Pop Zurich Oerlikon...
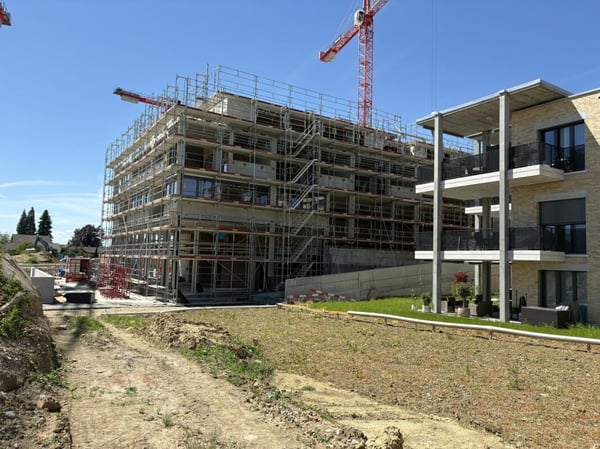
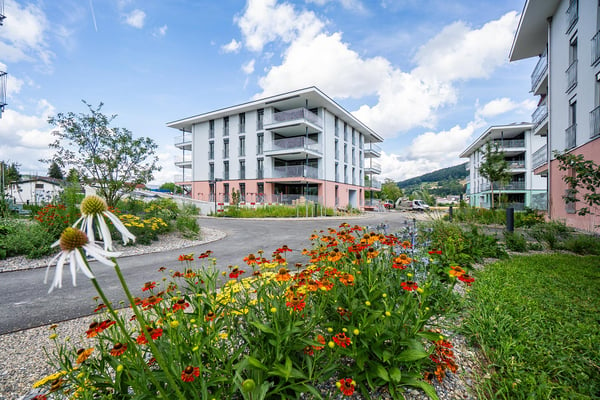
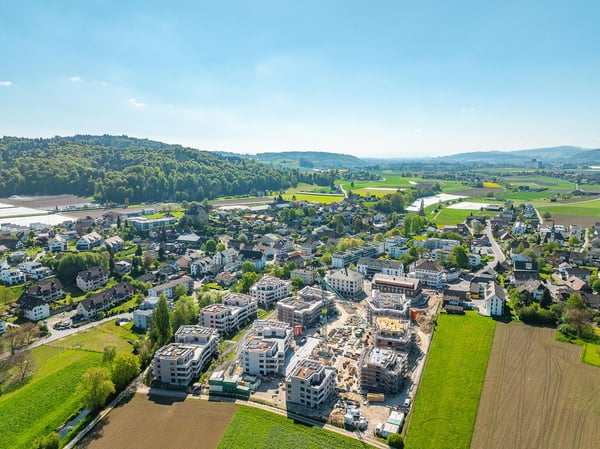
Erstvermietung per 01.12.2026 - Ein neues Kapitel - Ziegelei-Quartier Berg TG
Hauptstrasse 70
Erstvermietung: Ziegelei-Quartier - Hier will ich wohnen! Inmitten des aufstrebenden...
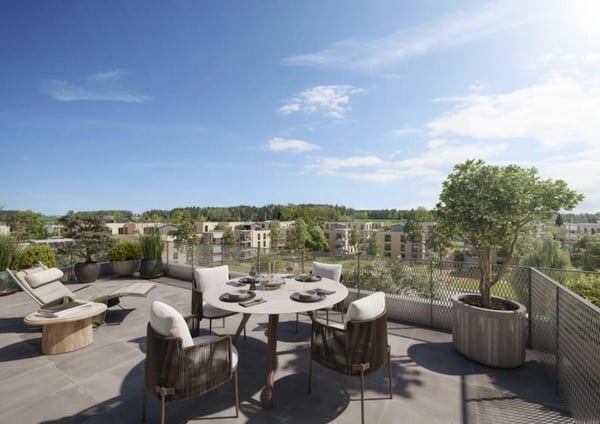
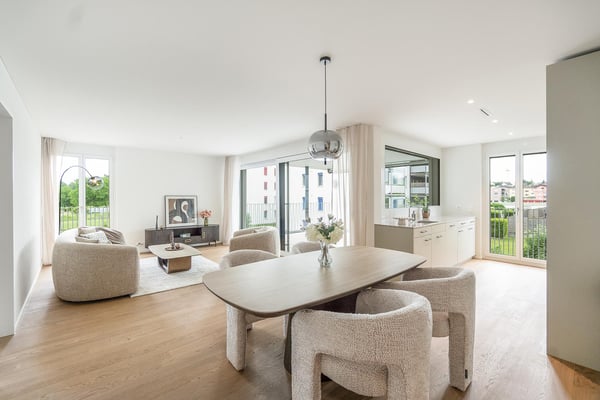
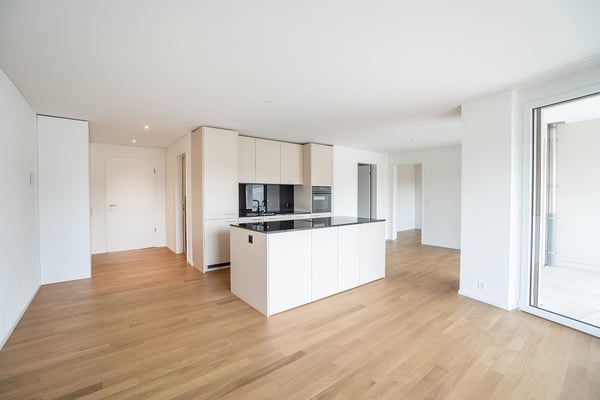
Neubauwohnungen mit durchdachtem Wohnkonzept
Hauptstrasse 70
Erstvermietung: Ziegelei-Quartier - Hier will ich wohnen! Inmitten des aufstrebenden...
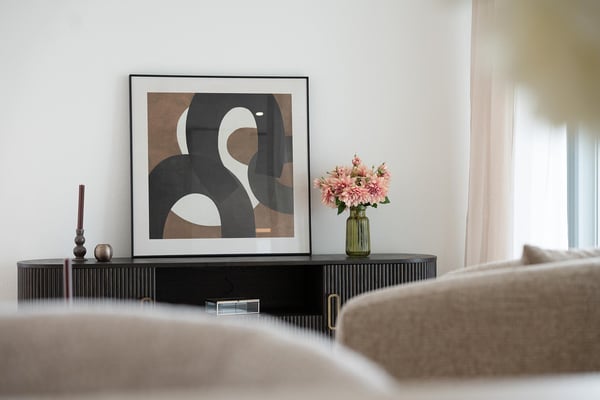
Attraktives Wohnen mit idealer Anbindung - Ziegelei-Quartier in Berg
Hauptstrasse 70
Erstvermietung: Ziegelei-Quartier - Hier will ich wohnen! Inmitten des aufstrebenden...

Modern Living, Calm Location – That’s 2night Basel
Badenstrasse 1
Der Mansion-Apartmenttyp bei CityPop 2night Basel bietet ein grosszügiges Loft, das modernes Design...

2night Basel – Relax in Style, Just Minutes from Downtown
Badenstrasse 1
Der Mansion-Apartmenttyp bei CityPop 2night Basel bietet ein grosszügiges Loft, das modernes Design...
City Pop - La solution flexible pour les longs et courts séjours, pour se sentir toujours chez soi !
Rue du Petit Rocher 6
Nous proposons des appartements d'environ 23 m², de différents types (taille S, M, L, XL, Duplex,...

City Pop – Zuhause fühlen in Bern – ab 350 CHF/Woche
Belpstrasse 23
Jetzt verfügbar! Wir bieten zentral gelegene Apartments in Bern, Belpstrasse 23, die zwischen 24 und 40 Quadratmeter gross sind.

City Pop - Deine flexible Lösung für lange und kürzere Aufenthalte um dich wie zu Hause zu fühlen
Bernerstrasse Süd 167-169
Willkommen im City Pop Zurich Altstetten! Unsere stilvoll eingerichteten Apartments an der...
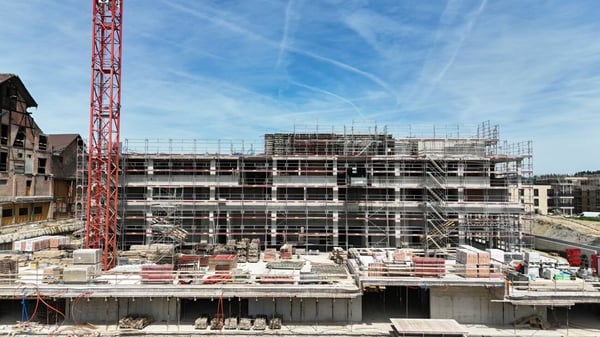
Top moderne Neubauwohnung in der sandgass.ch
Kanalstrasse 6
Willkommen in der sandgass.ch. In Reinach AG entstehen attraktive Mietwohnungen mit einem Wohnungsmix aus 1½- bis 4½-Zimmern.
Top moderne Neubauwohnung in der sandgass.ch
Kanalstrasse 6
Willkommen in der sandgass.ch. In Reinach AG entstehen attraktive Mietwohnungen mit einem Wohnungsmix aus 1½- bis 4½-Zimmern.
Special - 1 Zimmer geschenkt!
Lilienweg 2
Willkommen im mattenpark.ch."Z'Othmissingen" entstehen 100 moderne Mietwohnungen mit einem Wohnungsmix aus 1½- bis 5½-Zimmern.Profitieren
Special - 1 Zimmer geschenkt!
Lilienweg 4
Willkommen im mattenpark.ch."Z'Othmissingen" entstehen 100 moderne Mietwohnungen mit einem Wohnungsmix aus 1½- bis 5½-Zimmern.Profitieren
Erstbezug im schönen Reinach AG!
Kanalstrasse 12
Willkommen in der sandgass.ch. In Reinach AG entstehen attraktive Mietwohnungen mit einem Wohnungsmix aus 1½- bis 4½-Zimmern.